Practice · Executive reporting
Command Center
Nine pages that turn a project-controls workbook into the three things leadership needs from it — where we land on schedule and cost, how sure we are, and what to decide this month.
Executives on capital programs receive spreadsheets and status decks. The numbers are usually right and the story is usually missing: a single forecast date with no range, a cost forecast with no link to the funding that was actually authorised, a contractor’s schedule update with no audit of whether it can be believed, and no explicit ask.
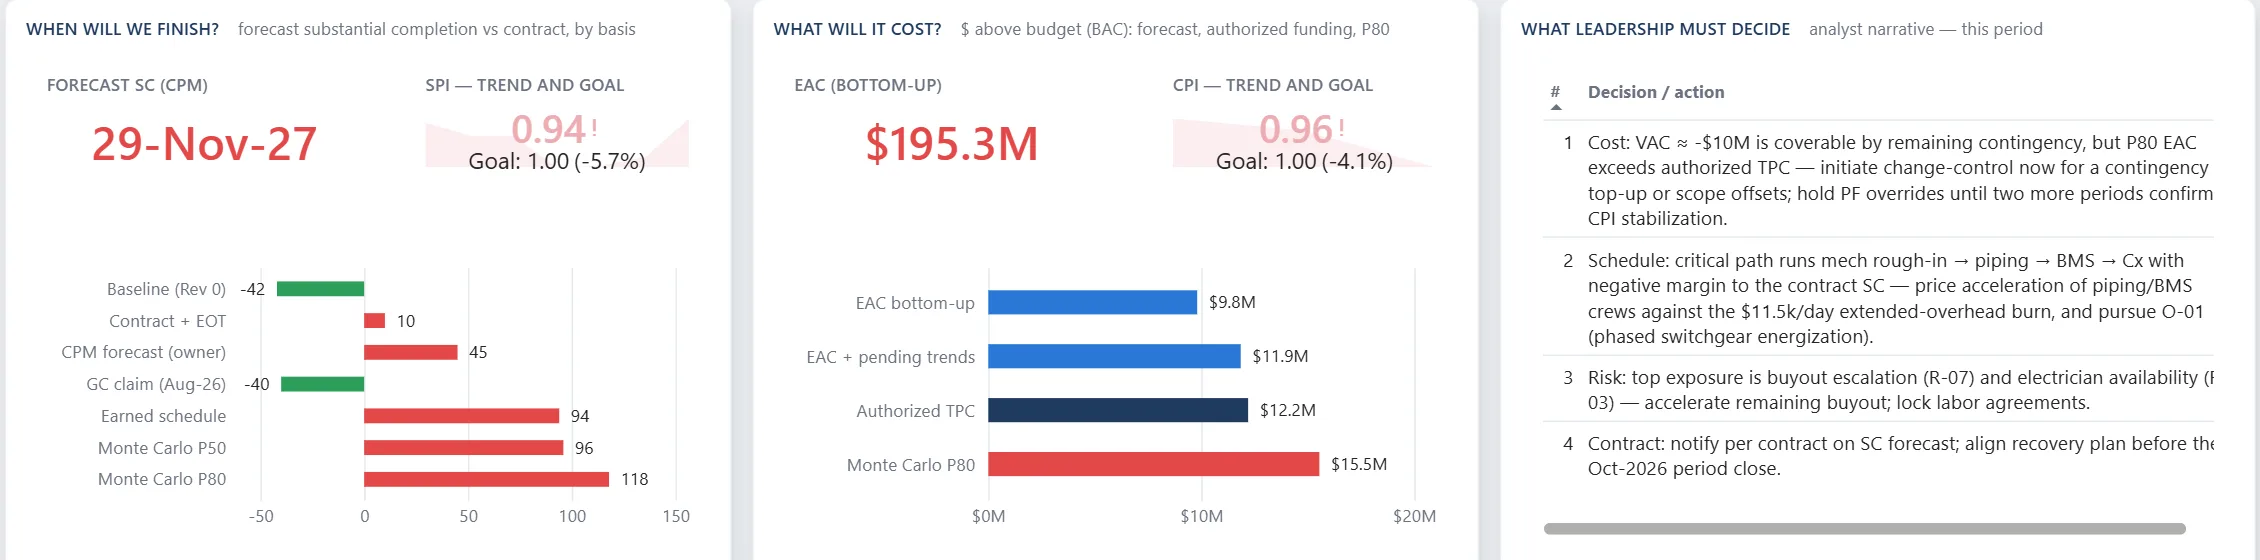
So the home page is built around three questions, in the order a board asks them. When will we finish? — forecast substantial completion against contract, with the completion date under every basis the programme carries, so the answer is a range and never a single date. What will it cost? — EAC against budget, authorised funding and P80, so the headroom is stated rather than implied. What must leadership decide? — this period’s decisions, in words, with the owner and the deadline against each one.
A sentence before the evidence
Every page opens with one sentence written from the data, not typed into a text box. On the cost page: EAC $195.3M (VAC −$9.8M) has risen $6.5M since January · pending trends add $2.0M · contingency covers the deterministic overrun — but not the P80 outcome. On the audit page: the GC’s update claims completion 05-Sep-27, 85 days earlier than the owner recompute — but it passes only 6 of 14 DCMA checks and carries 13 high-severity findings.
The evidence sits under the sentence. An EAC staircase from locked period closes. A variance waterfall by control account, each bar carrying its cause, its corrective action and its owner. A cash-flow curve with billed set against earned. A remaining-work Gantt with the data-date line drawn through it. The DCMA fourteen. Monte Carlo distributions with their cumulative curves and a driver tornado. The liquidated-damages position. Productivity by discipline. A rolling recordable-incident rate.
Generated, not drawn
The report is not built in Power BI Desktop and maintained by hand. Two Python scripts read the project-controls workbook — schedule, cost forecast, earned value, Monte Carlo, risk register, commitments, pay applications, claims, safety — export it to a star model, and write the whole report as a Power BI Project: the model, every measure, all nine pages and their backgrounds. Regenerating it takes under a minute, and it runs unchanged on any project that keeps its workbook in the same shape.
That is the decision underneath the others. A report somebody has to rebuild by hand each month drifts from its source, and a report that drifts from its source is one that will eventually be wrong in a way nobody can see. Generating it from the workbook means the report is only ever as wrong as the workbook, which is a failure mode with a name and an owner.
What is deliberately not on the page
Few numbers, each carrying a threshold, a trend and an owner. Status pills that use one rule set across every page rather than a judgement per visual. Variance against plan, budget and contract, rather than raw totals — the figure that tells you something is the distance from where you meant to be. Navy for structure, one blue for actual and earned, grey for plan, and red and green reserved for bad and good so they mean something when they appear. Forecast as a range, never a single date; the P80 shortfall stated in dollars rather than left to be inferred.
Beside Ridgeline
Ridgeline is the engine: it decides whether the numbers can be believed — re-running the contractor’s schedule rather than reading its dates, attributing the slip change by change, testing a claim against the daily record. Command Center is the layer above it: it decides whether an executive can act on those numbers in the ninety seconds they will actually spend. The two were built separately — this one reads a workbook, not Ridgeline — but they are two halves of the same job, and the audit page here is the shape Ridgeline’s findings take when they have to survive a boardroom.

Excel → Python (openpyxl, Pillow) → Power BI Project (TMDL model, PBIR report) → Power BI Desktop